0%

默认的视口输出居中并留有一定的余量用于注解标记。

但是如果想改变这些默认设置,可以使用pgvport(比例象限)、pgvsize(实际尺寸)等函数。这些函数都会在后面有详细介绍。

本教程既是PGPLOT的入门教程也是参考手册。

入门教程:介绍了如何使用PGPLOT

➢ 参考手册:关于PGPLOT的所有函数的定义和使用实例。
➢ 第二章:入门指导,列举了一个最简单的绘图程序
➢ 第三章:基本特性
➢ 第四章:介绍四种组成图像的基元:线条、图标记、文字、区域填充
➢ 第五章:如何改变基元的属性,比如颜色、线条类型、字体等
➢ 第六章:描述了一些经过包装的高级程序及函数
➢ 第七章:PGPLOT图像交互式的能力
➢ 第八章:图元文件的使用

 附录A:PGPLOT所有的函数原型
 附录B:PGPLOT注释可以用的字符和符号
 附录C:PGPLOT不同平台的安装
 附录D:PGPLOT支持的设备细节介绍
 附录E:扩展PGPLOT以支持其他设备的说明
 附录F:C语言中如何调用PGPLOT

一般说的包括两种:

  1. 产生硬拷贝输出的,比如ps文件等;
  2. 交互设备,只是显示在我们的显示器上。

输出设备描述格式:device name(file name)/ device type

本章节介绍了用PGPLOT创建一个图像的基础子程序,并有一些示例程序。

一个图像主要有下面几个部分组成:

  1. 坐标轴
  2. 标记
  3. 点或线

在使用PGPLOT画图的时候,至少要用到4个PGPLOT的子程序。

  1. PGBEGIN:开启PGPLOT并制定输出设备
  2. PGENV:设定图像的坐标轴范围、标签等
  3. PGPOINT/PGLINE:画点或线
  4. PGEND:关闭画图程序

当然,如果在一个设备上想画很多的图形,只需要重复23即可。而对于14,除非想在不同的设备上输出,否则只调用一次就够了。

编译并运行程序

在编译并链接好程序后,执行程序是会提示:

Graphics device/type (? to see list, default /Xserve):

这里我们输入“?”,查看一下可用的设备,我的如下所示,这个设备列表与安装时修改的drives.list相关联。

1
2
3
4
5
6
7
8
9
10
11
12
13
14
15
16
17
Graphics device/type (? to see list, default /Xserve): ?
PGPLOT v5.2.2 Copyright 1997 California Institute of Technology
Interactive devices:
/XWINDOW (X window window@node:display.screen/xw)
/XSERVE (A /XWINDOW window that persists for re-use)
Non-interactive file formats:
/GIF (Graphics Interchange Format file, landscape orientation)
/VGIF (Graphics Interchange Format file, portrait orientation)
/LATEX (LaTeX picture environment)
/NULL (Null device, no output)
/PNG (Portable Network Graphics file)
/TPNG (Portable Network Graphics file - transparent background)
/PS (PostScript file, landscape orientation)
/VPS (PostScript file, portrait orientation)
/CPS (Colour PostScript file, landscape orientation)
/VCPS (Colour PostScript file, portrait orientation)
Graphics device/type (? to see list, default /Xserve):

默认输出之屏幕,如上述图像所有,然后我选择/PS,就会发现在可执行程序相同目录中多了一个文件PGPLOT.ps文件(这个对于科研人员使用Latex调用图比较方便)。

PGPLOT 的一个示例程序

简介

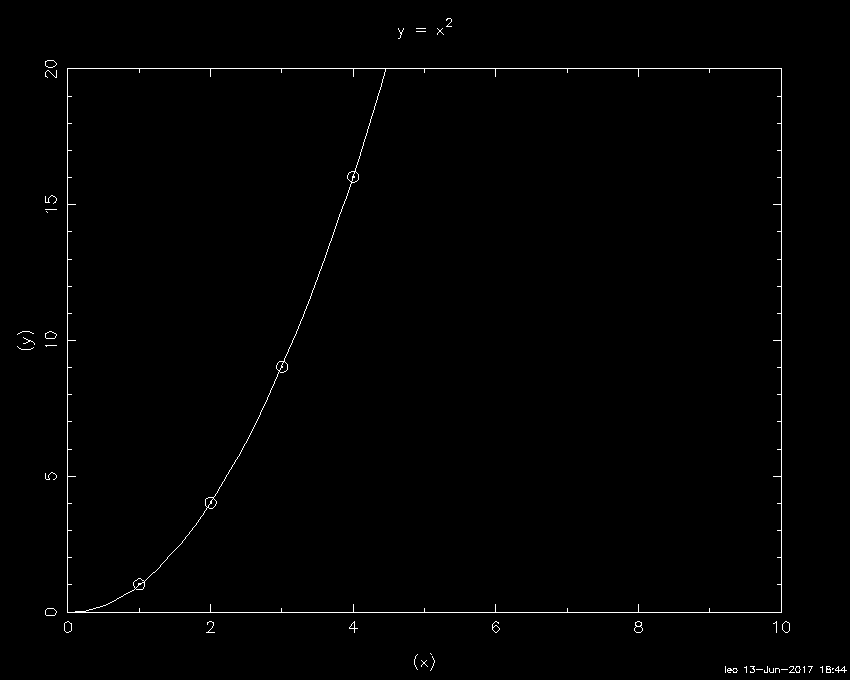
PGPLOT典型的应用主要是一些已知测定点的描绘和理论曲线的比对。

这里给出一个简单的例子程序,画出5个数据点,理论曲线为y=x^2。

代码

代码如下所示:

1
2
3
4
5
6
7
8
9
10
11
12
13
14
15
16
17
18
19
20
21
22
23
24
25
26
27
28
29
30
31
32
33
34
35
36
37
38
39
40
41
42
43
44
45
46
47
48
49
50
51
/**
* Copyright (c) 2010-2017, Guo Shaoguang
*
* All rights reserved.
*
* @file shao_pgplot_y=x2.c
* @author Guo Shaoguang
* @email sgguo@shao.ac.cn
* @date 2011.06.11
* @version v1.0
*
* @brief This file will y=x^2 using PGPLOT
*/

#include "../include/cpgplot.h"
#include <stdio.h>
#include <stdlib.h>

int main() {
int i;
static float xs[] = {1.0, 2.0, 3.0, 4.0, 5.0};
static float ys[] = {1.0, 4.0, 9.0, 16.0, 25.0};
float xr[100], yr[100];
int n = sizeof(xr) / sizeof(xr[0]);

printf("Now begin to plot ...\n");

/// 1. Enable the PGPLOT and setting the device
if (cpgbeg(0, "?", 1, 1) != 1)
return EXIT_FAILURE;

/// 2. Setting the axis of x and y including label
cpgenv(0.0, 10.0, 0.0, 20.0, 0, 1);
cpglab("(x)", "(y)", "y = x\\u2\\d");
cpgiden();

/// 3. Begin plot points / lines
cpgpt(5, xs, ys, 9);

for (i = 0; i < n; i++) {
xr[i] = 0.1 * i;
yr[i] = xr[i] * xr[i];
}

cpgline(n,xr,yr);

/// 4. Close the PGPLOT
cpgend();

return EXIT_SUCCESS;
}

结果

Result

关于数据初始化就不多做解释了。

但凡对C语言有了解的人,应该和容易明白上述代码(除了PGPLOT调用子函数)。