1
2
3
4
5
6
7
8
9
10
11
12
13
14
15
16
17
18
19
20
21
22
23
24
25
26
27
28
29
30
31
32
33
34
35
36
37
38
39
40
41
42
43
44
45
46
47
48
49
50
51
|
#include "../include/cpgplot.h"
#include <stdio.h>
#include <stdlib.h>
int main() {
int i;
static float xs[] = {1.0, 2.0, 3.0, 4.0, 5.0};
static float ys[] = {1.0, 4.0, 9.0, 16.0, 25.0};
float xr[100], yr[100];
int n = sizeof(xr) / sizeof(xr[0]);
printf("Now begin to plot ...\n");
if (cpgbeg(0, "?", 1, 1) != 1)
return EXIT_FAILURE;
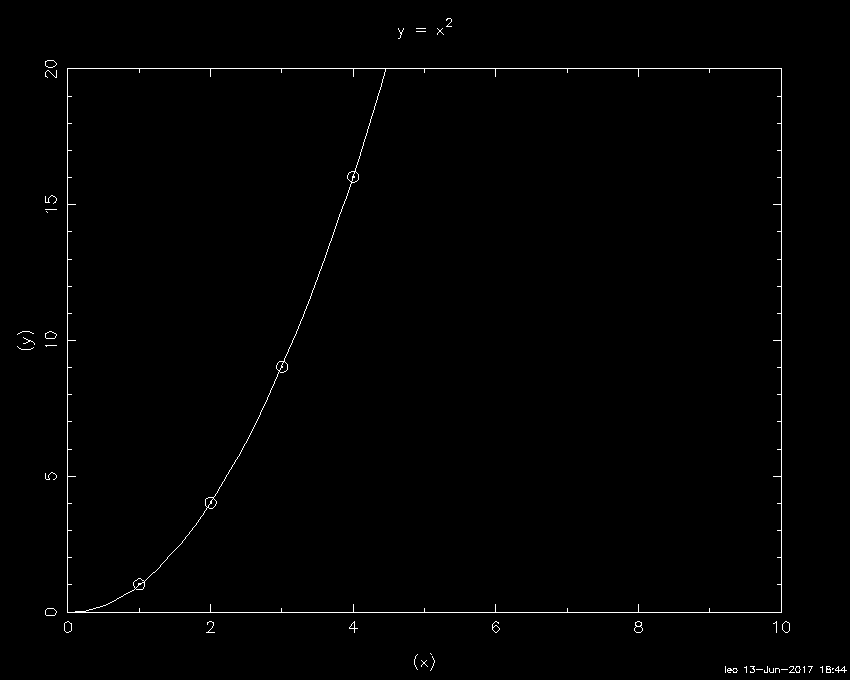
cpgenv(0.0, 10.0, 0.0, 20.0, 0, 1);
cpglab("(x)", "(y)", "y = x\\u2\\d");
cpgiden();
cpgpt(5, xs, ys, 9);
for (i = 0; i < n; i++) {
xr[i] = 0.1 * i;
yr[i] = xr[i] * xr[i];
}
cpgline(n,xr,yr);
cpgend();
return EXIT_SUCCESS;
}
|